pytc
A python software package for analyzing Isothermal Titration Calorimetry data. The name is a portmanteau of Python and ITC.
Introduction
pytc is python software used to extract thermodynamic information from isothermal titration calorimetry (ITC) experiments. It fits arbitrarily complex thermodynamic models to multiple ITC experiments simultaneously. We built it with three design principles:
- Open source and cross platform. The full source code should be available. The program should not require proprietary software to run.
- Ease of use. Fitting basic models should be easy. Implementing completely new thermodynamic models should be straightforward.
- Accessible for users and programmers. It should have both a GUI and a well-documented API.
Our implementation is built on python3 extended with numpy, scipy, matplotlib and emcee. The GUI is built on pytq5.
Features
Documentation
Warning
pytc will fit all sorts of complicated models to your data. It is up to you to make sure the fit is justified by the data. See the Fitting and statistics section to see what pytc reports to help in this decision making.
API Quick Start
If you already have a python3-based scientific computing environment installed, you can start using the API by:
# Install pytc
pip3 install pytc-fitter

# Clone the demos repo
git clone https://github.com/harmslab/pytc-demos

# Fire up jupyter
cd pytc-demos
jupyter notebook
Example code using the API
Fit a \(Ca^{2+}/EDTA\) binding experiment to a single-site binding model.
import pytc

# Load in integrated heats from an ITC experiment
e = pytc.ITCExperiment("demos/ca-edta/tris-01.DH",
                       pytc.indiv_models.SingleSite)

# Create the global fitter, add the experiment, and fit
g = pytc.GlobalFit()
g.add_experiment(e)
g.fit()

# Print the results out
g.plot()
print(g.fit_as_csv)
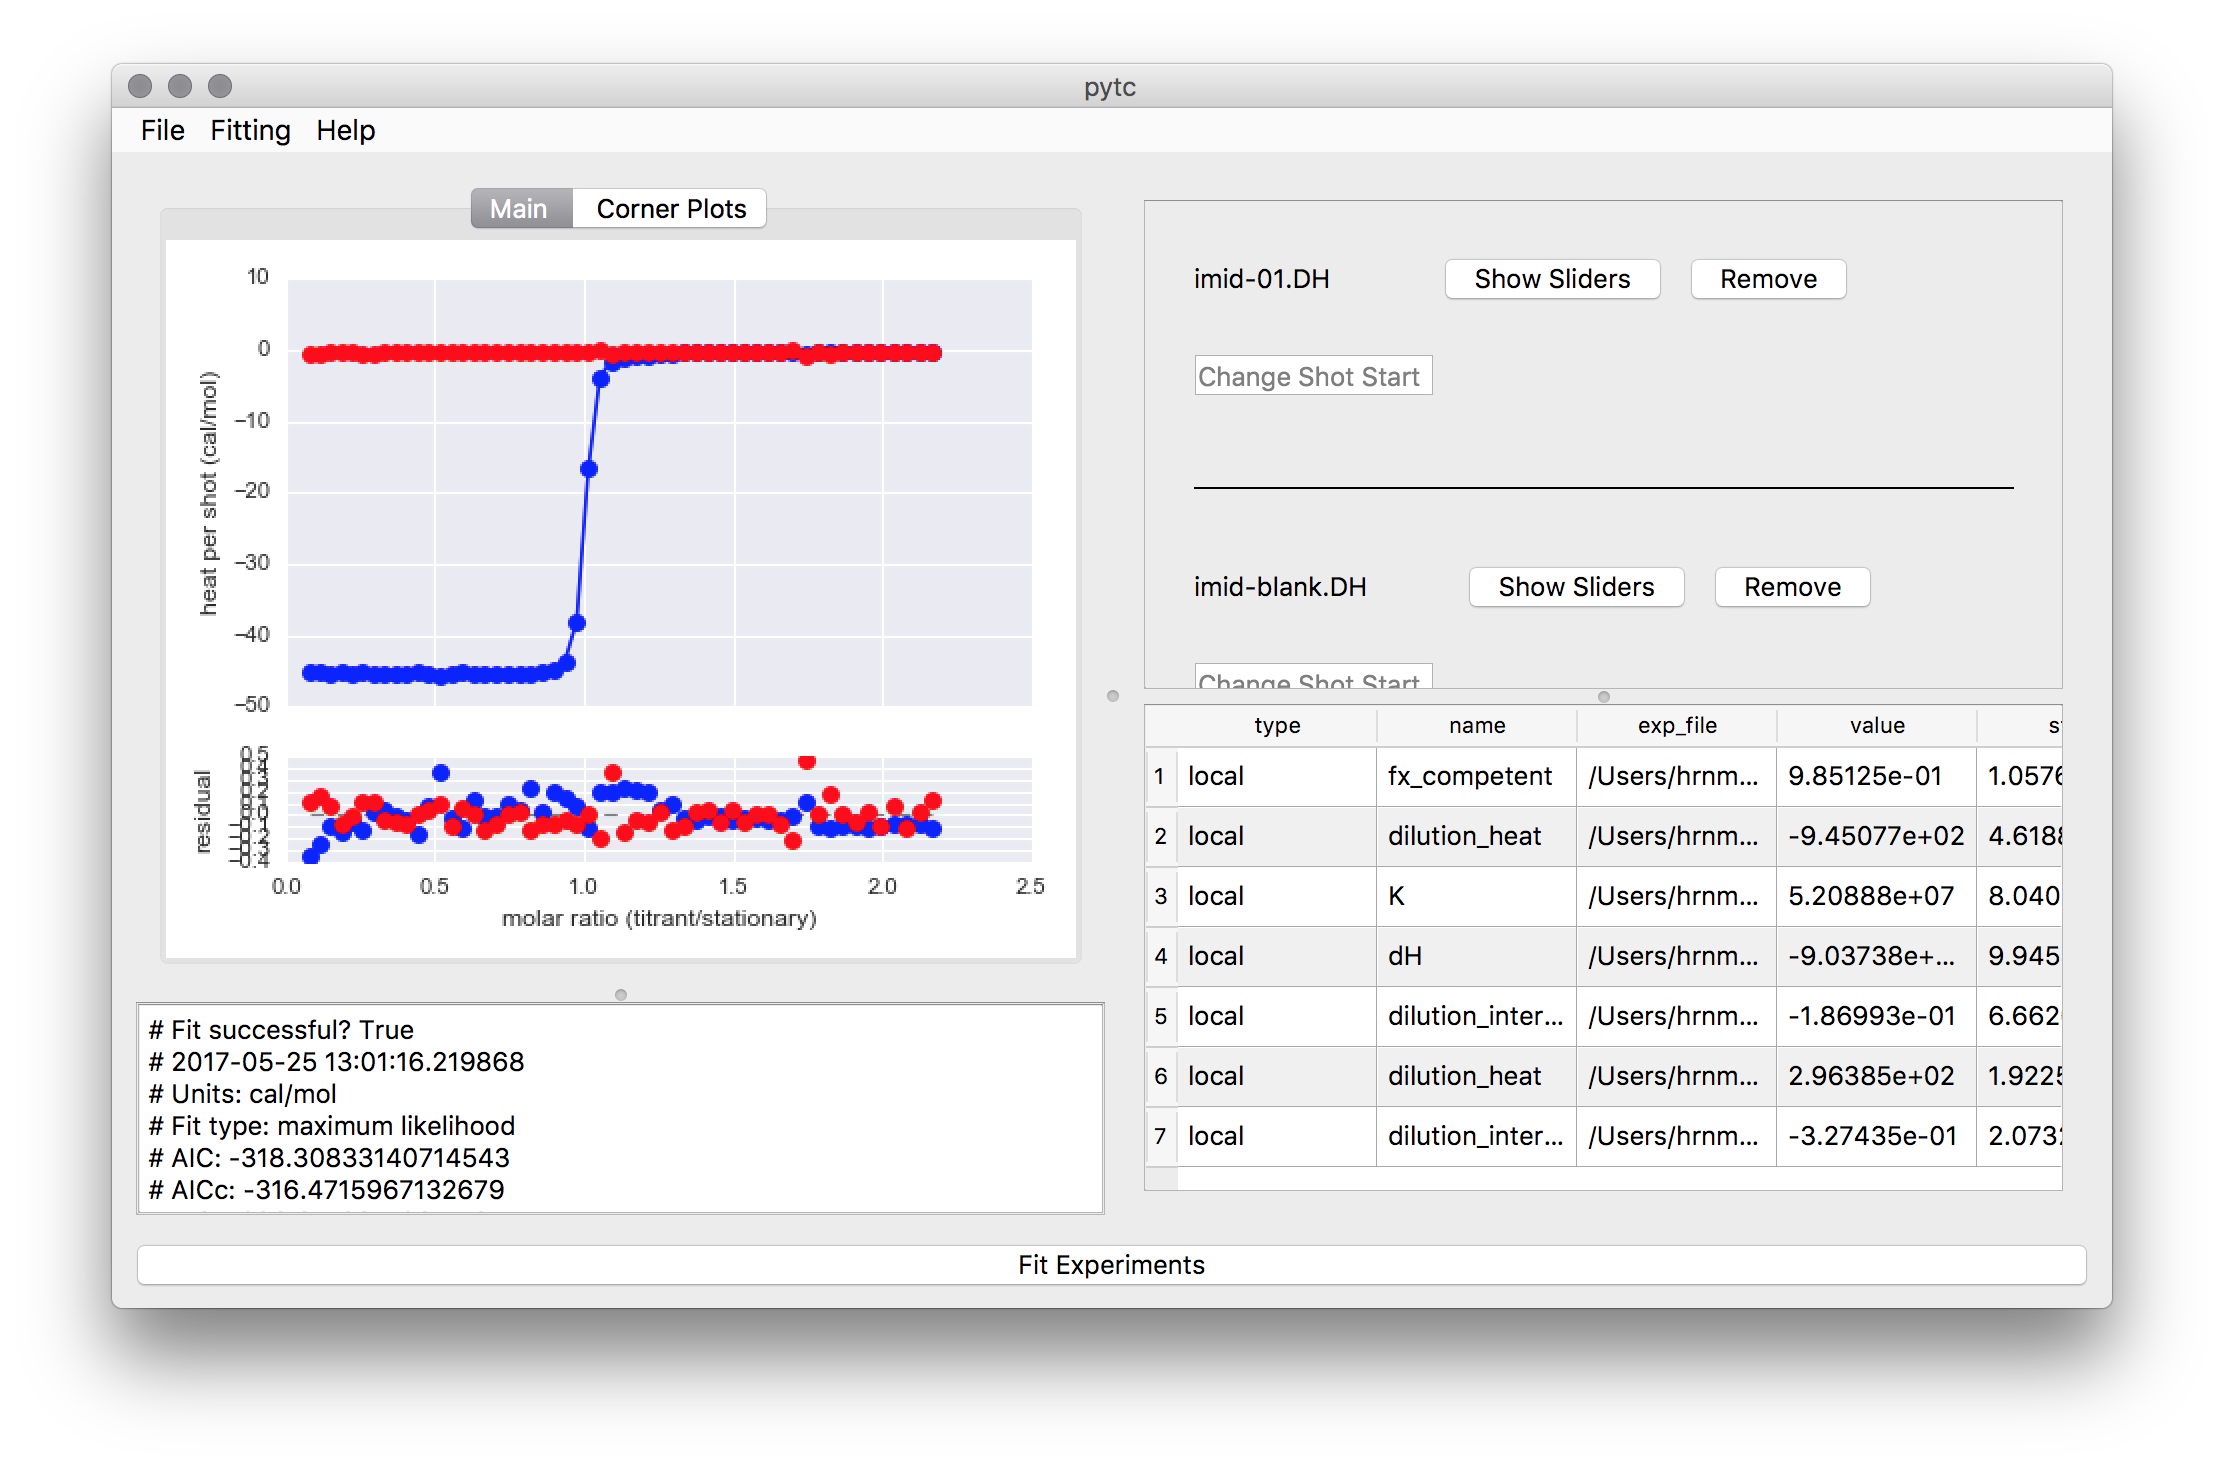
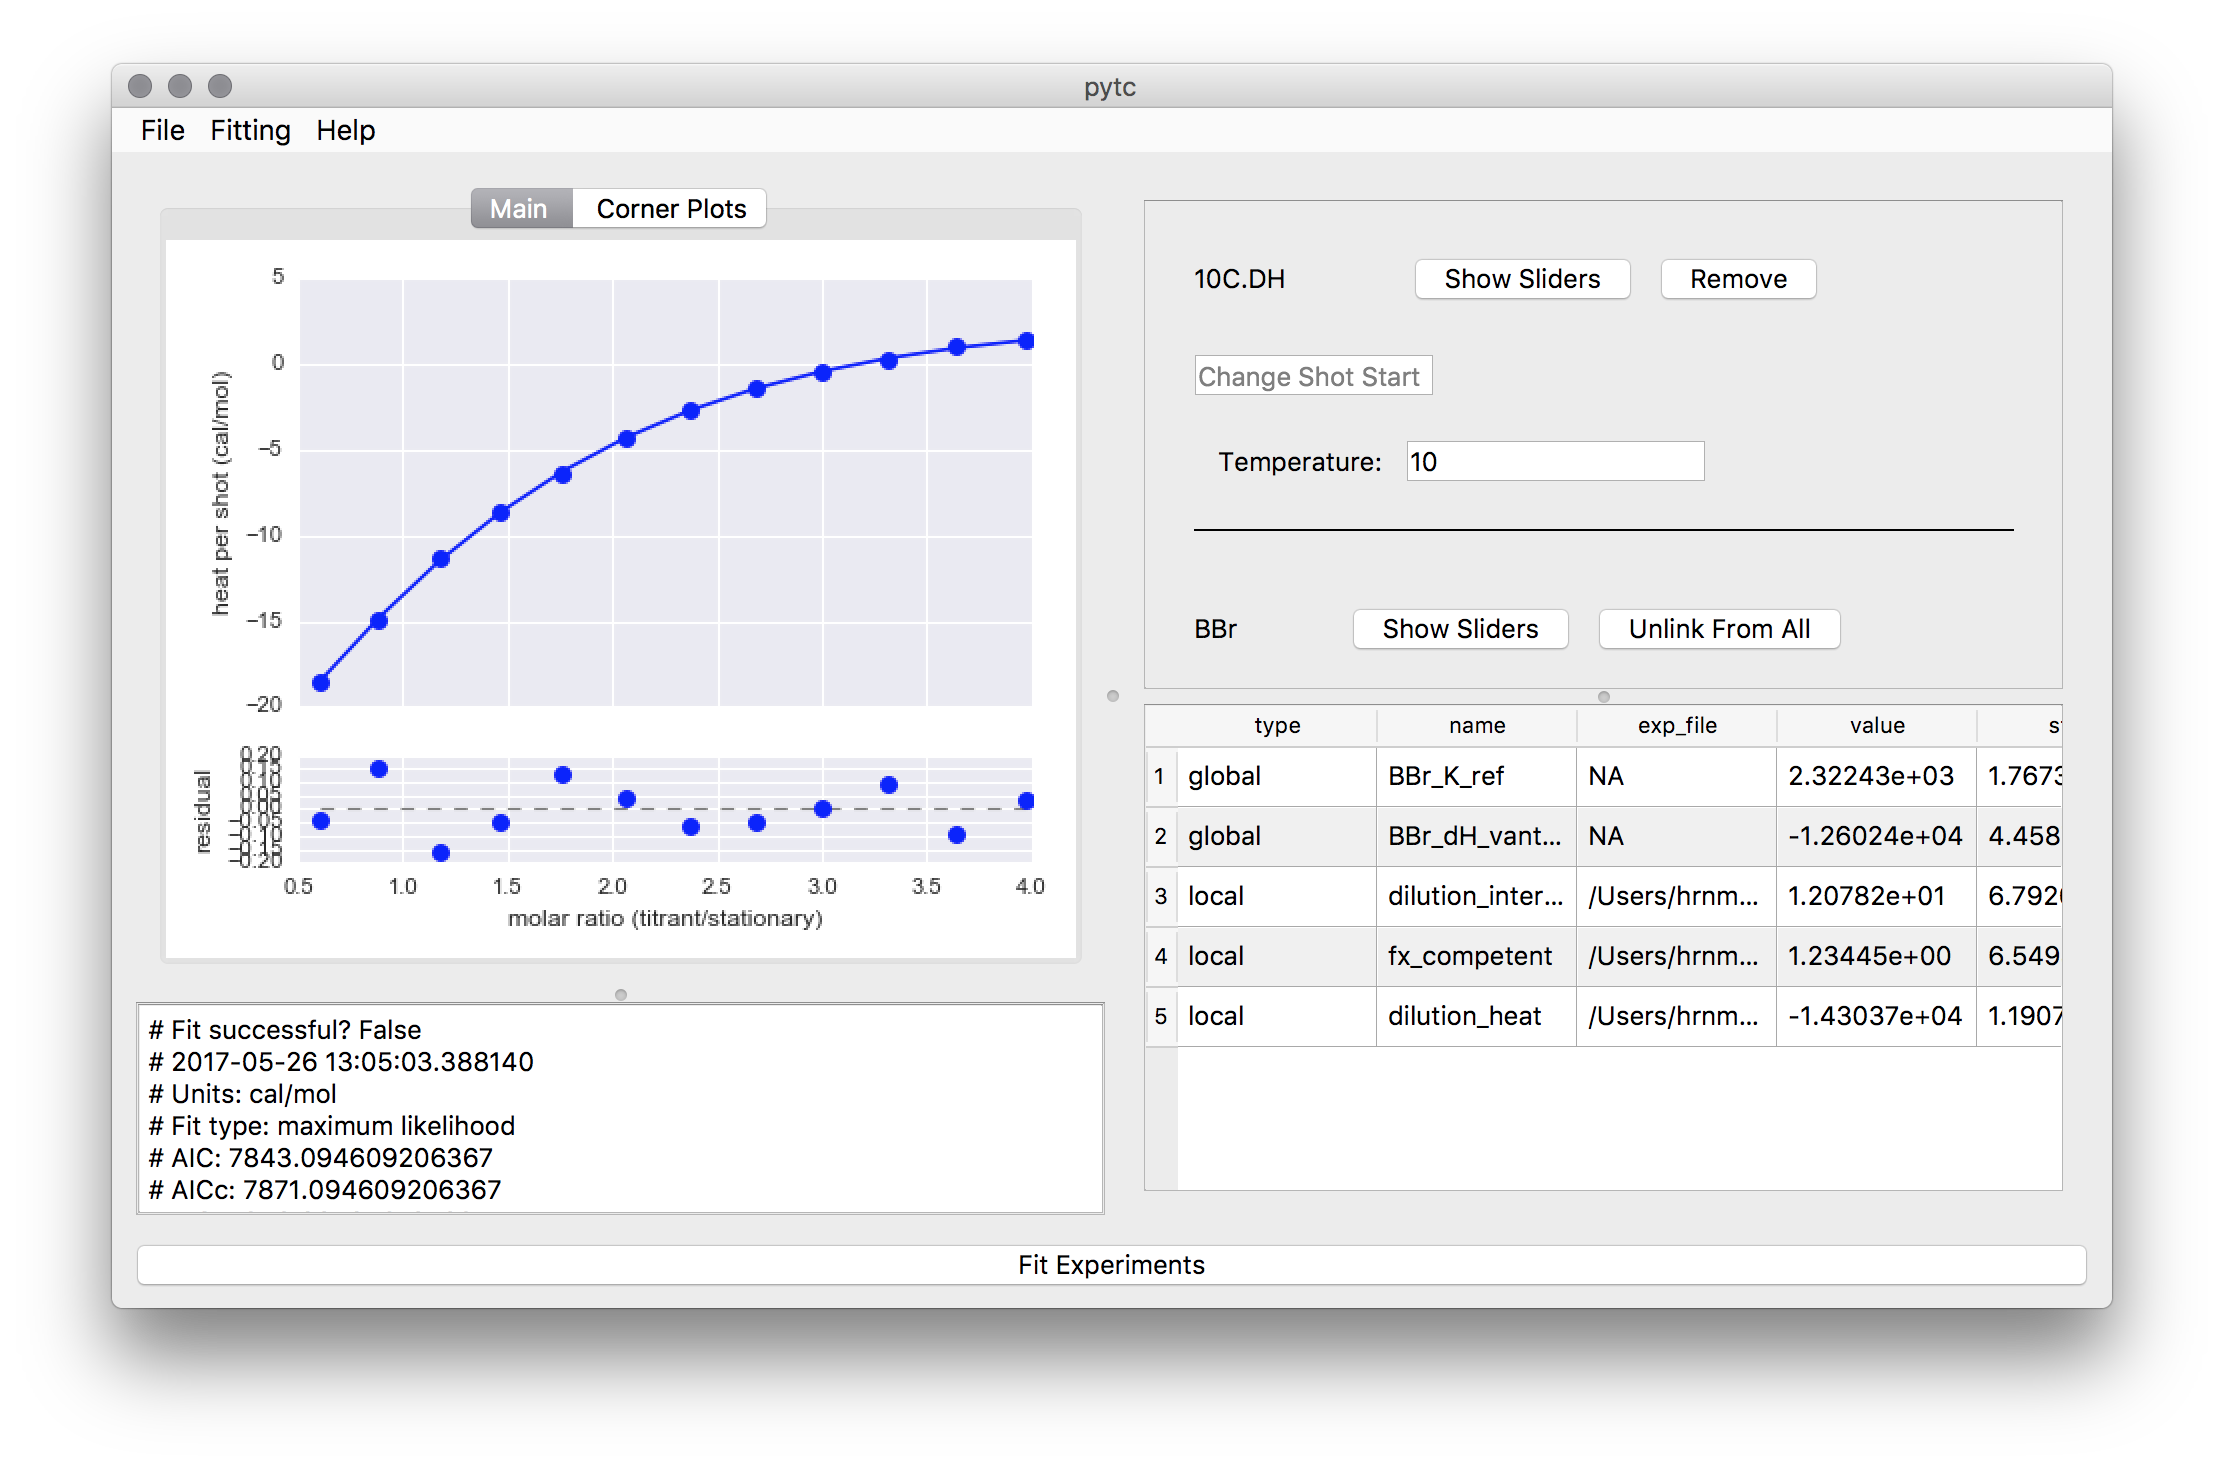
GUI
The GUI is installed separately from the API. Instructions are here. The GUI docs are here. A few screenshots showing the GUI in action are below.